Self-Service
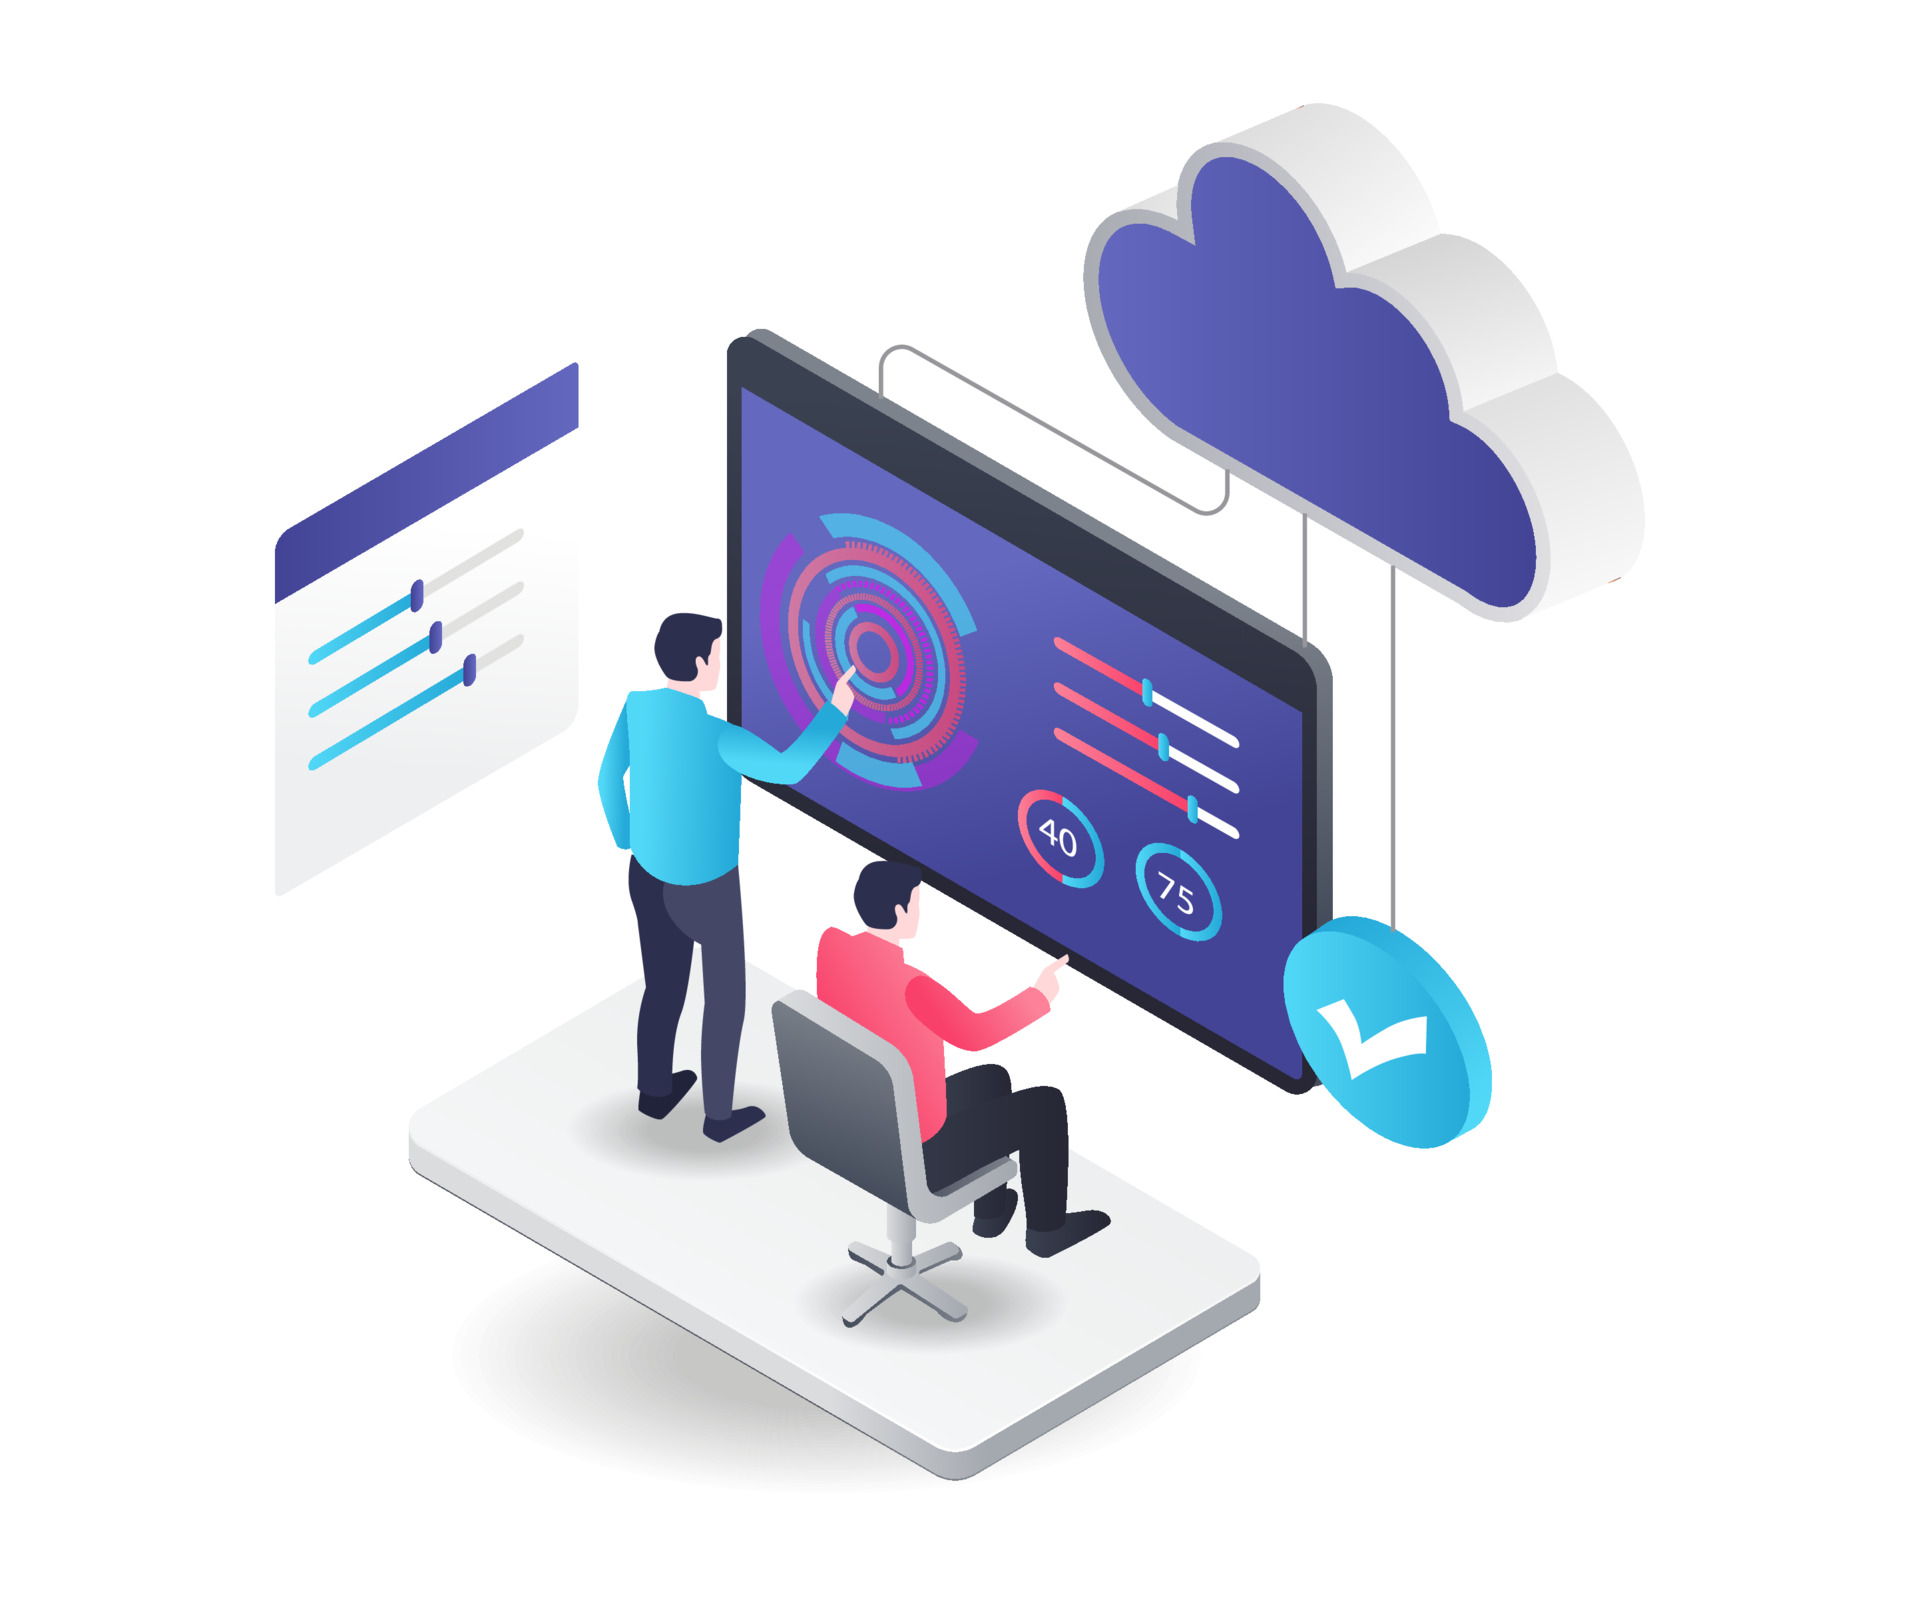
Our Self-service dashboards allow analysis based on existing data sources while minimizing the query language needed to pull the data. This permits user to be more focused on modeling and business decisions from data gathering
Our Self-service dashboards allow analysis based on existing data sources while minimizing the query language needed to pull the data. This permits user to be more focused on modeling and business decisions from data gathering
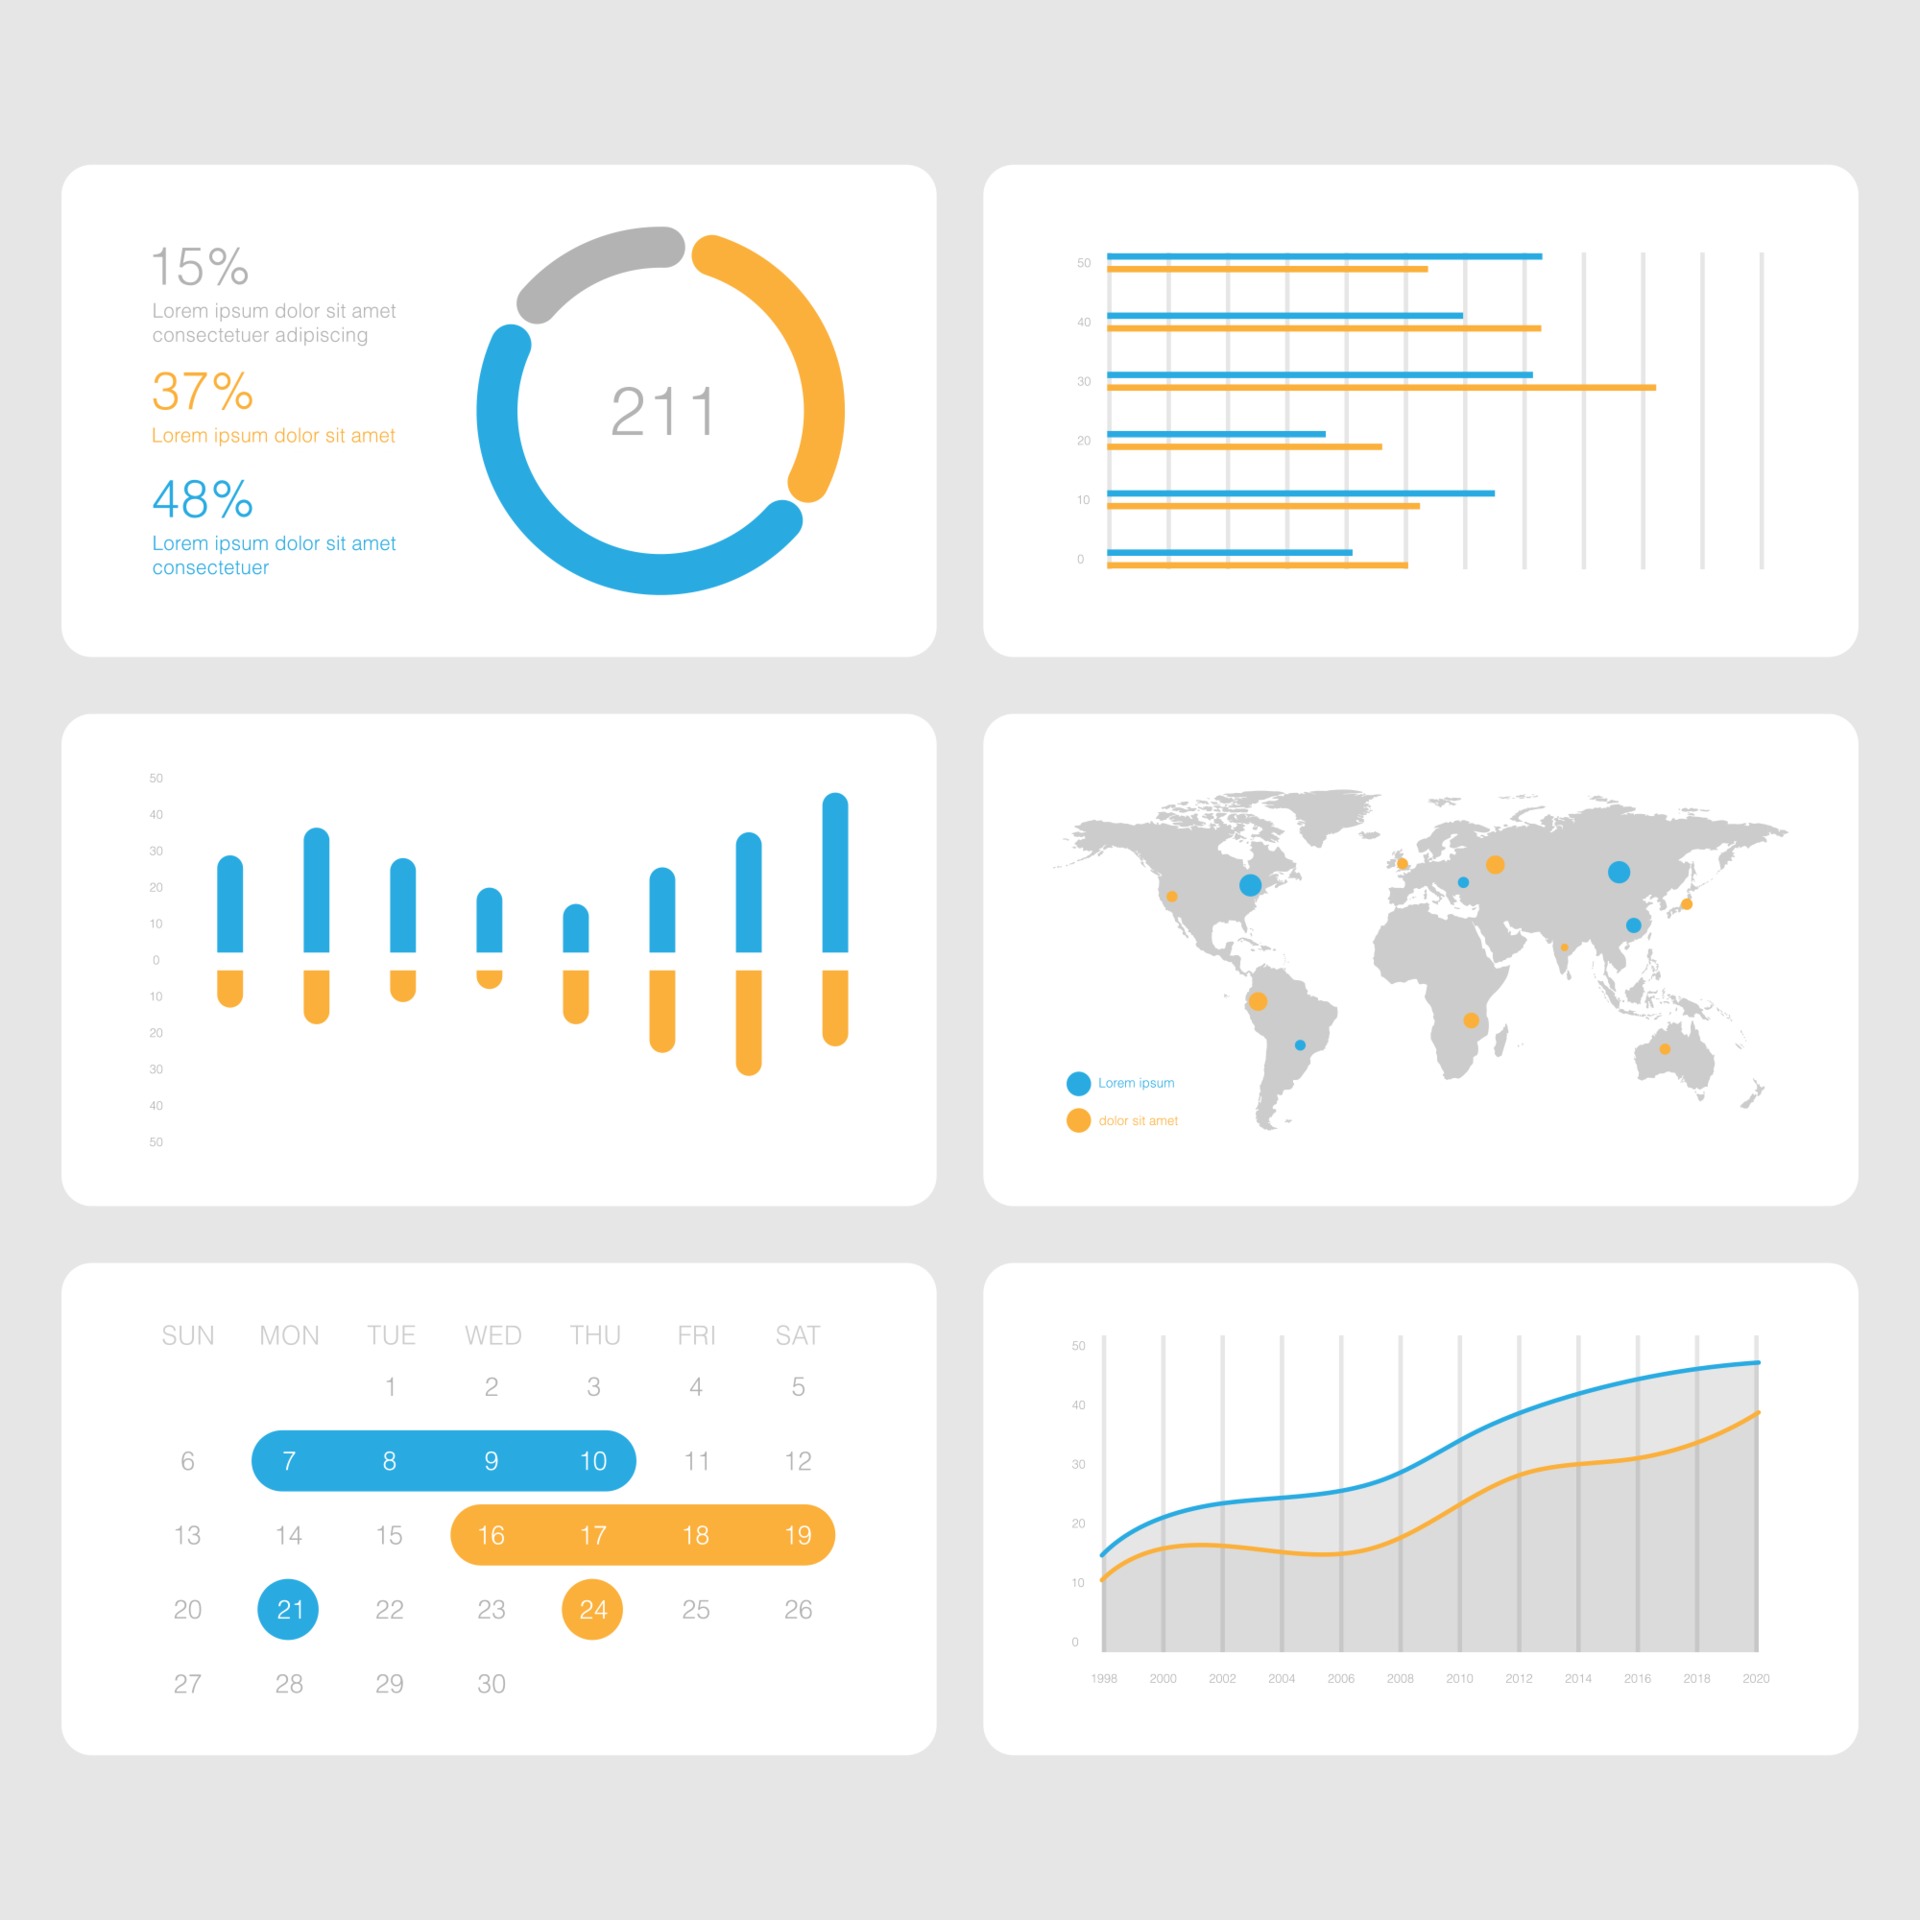
Main purpose of data visualisation and business intelligence. Input data can come from a variety of sources, including from a database, webpage, or structured files such as an Excel spreadsheet, a CSV file, and so on. These data can then be visualised via different visuals to communicate insights.
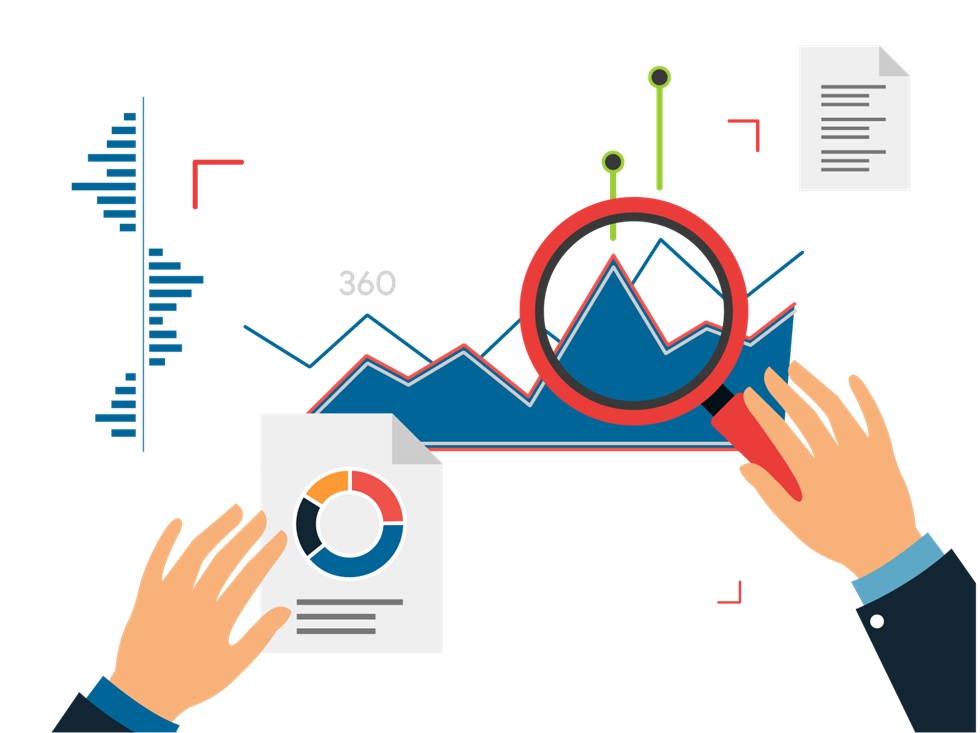
Big Data analytics is a process used to extract meaningful insights, such as hidden patterns, unknown correlations, market trends, and customer preferences. Big Data analytics provides various advantages, it can be used for better decision making, preventing fraudulent activities, among other things.
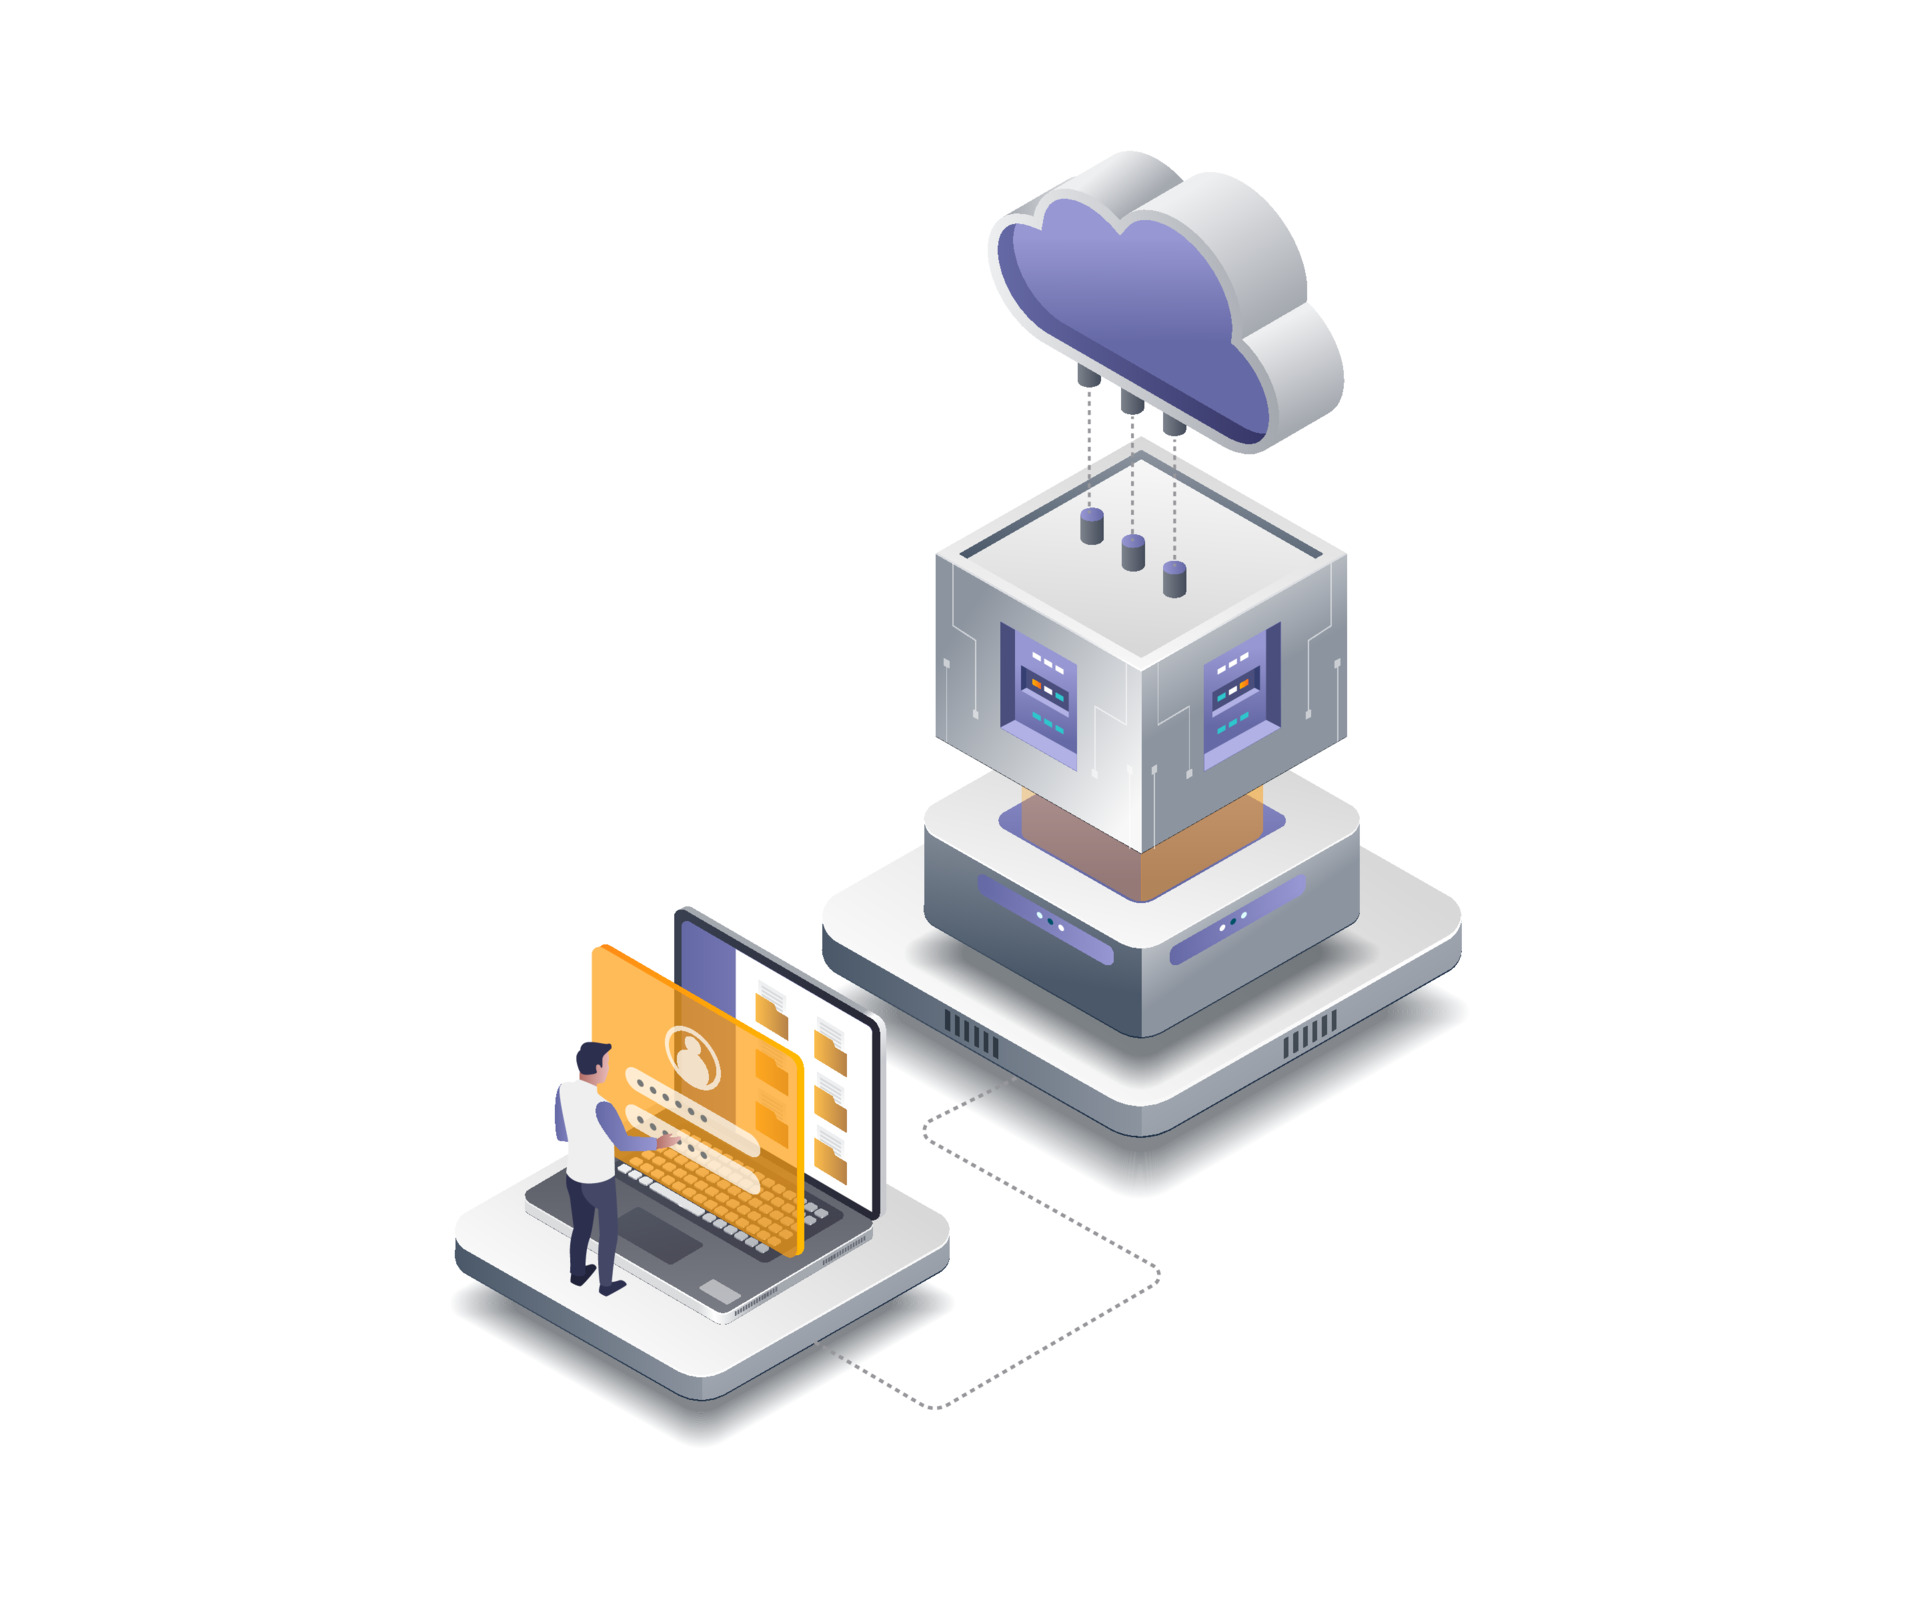
You can set up a report to run itself daily, weekly, or monthly and send the results automatically to the people who need them. That way, you don't have to remember to log in and do it yourself.